
Buy This, Not That: 3 Preferred Funds Yielding 7%-9%

Is there still a chance to buy the bank dip? You bet—with nifty yields up to 9.4%!
We’re going to avoid the regional lenders, which pains me to say because I love banking with the small guys. But I’m not looking to own them as the economy slows down.
No, nothing personal, but I’ll take the banking behemoths. None of them yield 9.4%, of course, but we engineer these payouts easily via their preferred dividends.
Preferred stocks are often referred to as stock-bond “hybrids” given that they share some characteristics of each asset. A quick breakdown:
- They represent ownership in a company (like a stock)
- They typically don’t offer voting rights (like a bond)
- They pay dividends (like a stock)
- Their dividends are typically fixed at a certain level (like a bond)
- They can rise and decline based on the performance of the underlying company (like a stock)
- But they tend to be much more stable, trading around a “par value” like a bond)
Most noteworthy, for income fanatics like you and I, is that their dividends are plump. It’s pretty common for preferreds to yield in the 6%-75% range, and it’s not hard to find preferreds that dole out even more.
So, wait. What does this all have to do with banks?
While companies from many sectors issue preferred stocks, they’re most prevalent in the financial sector. Most preferred funds are at least 50% invested in the preferred stock of banks, insurers and other financial firms. And typically, the yields you can get on their preferreds is much, much larger than you can get from their common shares.
Citigroup (C) is a great example. Citigroup kneecapped its dividend during the Great Recession, then started rebuilding its payout in 2015. At 53 cents per share, it’s just 1 cent off of its pre-Great Recession dividend—if you don’t account for its 1-for-10 reverse stock split in 2011, of course. Nonetheless, the yield has improved to a range typically between 2% and 5%.
Citigroup: A Decent-Paying Dividend Stock
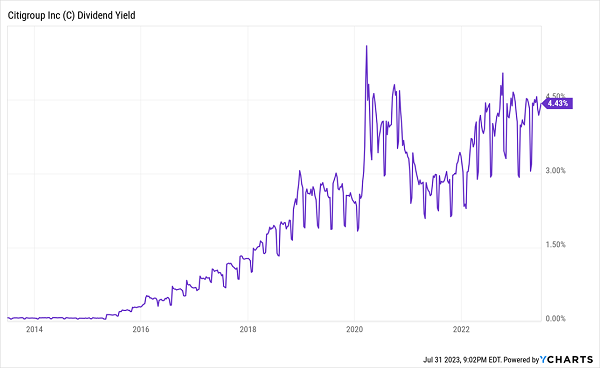
So, you could invest in Citigroup that way—buying its common shares and collecting 4% in yield, while owning shares that have largely underperformed the sector for years.
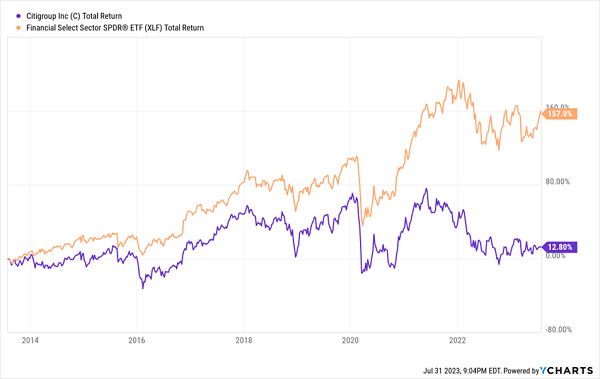
Or we could buy its Series J preferreds, which aren’t nearly as volatile, and earn a fat 7% instead.
Sure, the upside is relatively capped given that preferreds trade around a par value. But that also means you’re not taking on all the risk of Citigroup’s common shares, and you’re collecting nearly twice the yield all the while.
But I’m not recommending you go out and buy Citigroup’s preferreds.
Individual preferreds are difficult for most retail investors to research, and they’re frankly more difficult to buy, period. I think they’re best bought in fund form, where you can get some instant diversification as well.
Just don’t bother with ETFs. Closed-end funds (CEFs) allow us to buy preferreds collectively at greater discounts than if we had bought them individually, and we get the added benefit of active managers who specialize in this kind of asset.
To give you an idea of what I mean, I’m going to show you three popular preferred ETFs—responsible for billions of dollars of “dumb money” assets. Then I’ll tell you what CEFs we should replace them with—three funds yielding between 7.6% and 9.4% right now!
VANILLA ETF: iShares Preferred & Income Securities ETF (PFF)
Yield: 6.2%
The iShares Preferred & Income Securities ETF (PFF) is the default plain-vanilla preferred ETF. It came to life in 2007, and has since amassed more than $13 billion in assets, making it the largest preferred fund by a mile.
PFF invests in more than 460 U.S. preferreds, more than 70% of which come from financial-sector names such as Wells Fargo (WFC) and Bank of America (BAC). It also has a relatively low credit quality—just more than half of assets are investment-grade—but one of the highest yields among preferred ETFs.
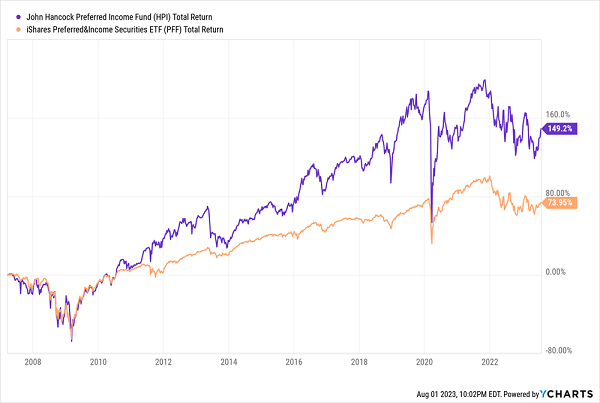
CONTRARIAN PLAY: JHancock Preferred Income (HPI)
Distribution Rate: 9.4%
The John Hancock Preferred Income Fund (HPI) is plenty established itself, having traded in preferreds since 2002.
But it doesn’t always trade in preferreds. Its 131 holdings include preferred and preferred convertible securities, yes, but it also has the option of holding U.S. government agency bonds, corporate bonds, foreign bonds, and both domestic and international stocks.
HPI management doesn’t just sit on this flexibility—it uses it.
Consider this: Over the past decade, HPI’s portfolio has included up to 98% preferreds. Today, that allocation is just 56%—the majority of it banks and other financials—while corporate bonds make up nearly 40% of assets.
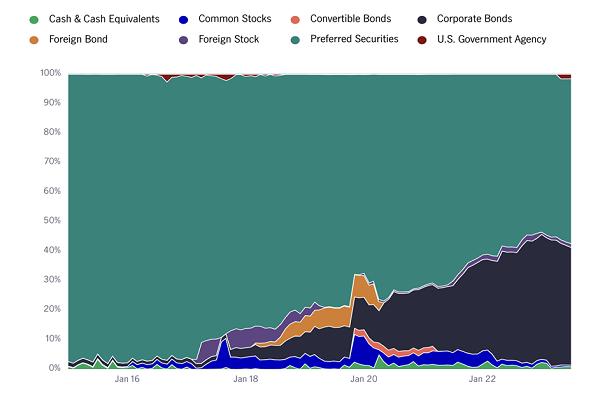
HPI’s management also has another tool at its disposal: leverage. And it’s similarly aggressive with it, amplifying its holdings with nearly 40% in debt leverage at the moment.
While that results in a much more volatile portfolio of preferreds, it also enables HPI to pay out a 9%-plus yield. It’s also a more productive portfolio—one that has more than doubled up PFF since its inception in 2007.
HPI: How Active Management Can Trounce Basic Indexing
VANILLA ETF: Global X U.S. Preferred ETF (PFFD)
Yield: 6.6%
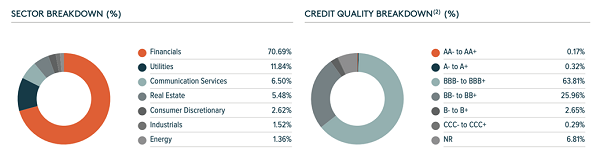
The Global X U.S. Preferred ETF (PFFD) isn’t in the top-three of preferred ETFs, but it’s still a respectable fund with more than $2 billion in assets. It’s a portfolio of U.S. preferreds that’s little different than the rest—fat in preferreds (70%), with lighter exposure to other sectors, such as utilities (11%) and communication services (7%).
This is also a high-quality portfolio—one with nearly 65% exposure to investment-grade bonds.
CONTRARIAN PLAY: Nuveen Preferred & Income Opportunities Fund (JPC)
Distribution Rate: 8.1%
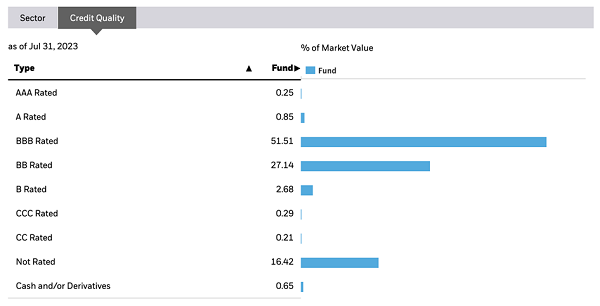
The Nuveen Preferred & Income Opportunities (JPC) delivers an 8%-plus yield through a basket of fairly high-quality preferreds.
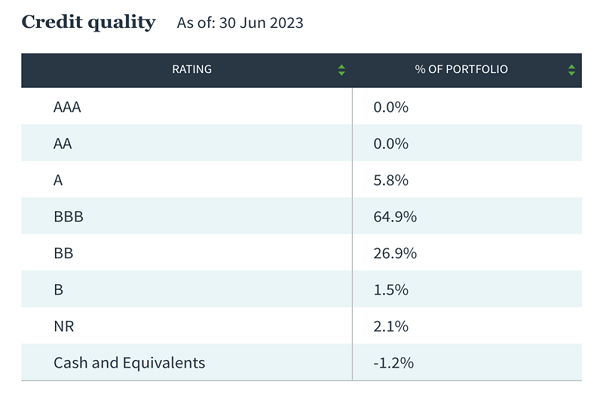
Nearly two-thirds of JPC’s 231-stock portfolio are investment-grade, including 6% exposure to A-rated preferreds. BBs are another 27%, leaving just a peppering of B-rated and unrated issues. And following the theme of preferred funds loving banks, financial preferreds represent more than three-quarters of assets.
JPC has a great deal of international exposure, with ex-U.S. preferreds making up nearly 40% of the fund. Indeed, JPC is a very global CEF, with positions including the likes of HSBC (HSBC), Lloyds Banking Group (LYG) and Barclays (BCS). And like the other preferred CEFs on this list, it uses a high amount of debt leverage (37%).
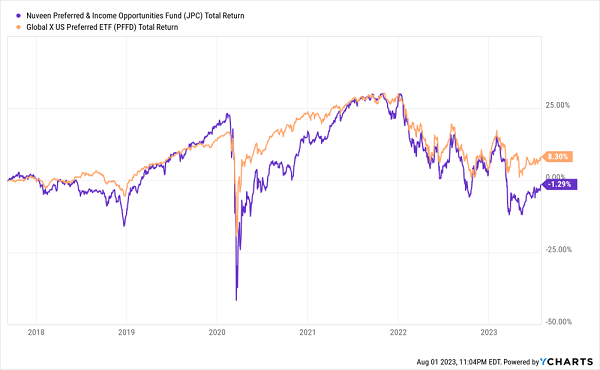
The Nuveen CEF is a longtime outperformer since it came to life in 2003. But rocketing interest rates have yanked the fund lower—not just because of what they did to preferred-stock prices, but also because they raised the expenses of that debt leverage.
JPC Has Struggled to Keep Up With the Joneses
VANILLA ETF: First Trust Preferred Securities and Income ETF (FPE)
Yield: 5.7%
The First Trust Preferred Securities & Income ETF (FPE) is a fairly large preferred ETF at $5.6 billion in assets. It has a robust portfolio of more than 280 preferreds, about two-thirds of which are investment-grade in nature. Three-quarters of holdings are financial-sector stocks; energy stocks are the only other meaningful chunk at about 8%.
First Trust’s ETF is a big outlier in that only about half of its portfolio is U.S.-based. The rest is international, boasting preferreds from the U.K. (11%), Canada (10%), Bermuda (6%) and more. Also, FPE is a rarity in that it’s an actively managed preferred portfolio—and as you’d expect, you lose a lot of that low-fee edge you get from index preferred ETFs.
CONTRARIAN PLAY: Flaherty & Crumrine Preferred Securities (FFC)
Distribution Rate: 7.6%
Flaherty & Crumrine Preferred Securities (FFC) is on the lower end of preferred CEF yields, and even it easily bests all of the preferred ETFs on this list.
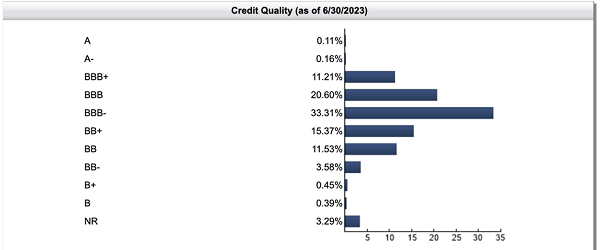
Flaherty & Crumrine’s closed-end fund is as tilted toward the finance sector as they come. More than 80% of the portfolio comes from banks, including a 23% slug in insurance companies. That’s a nice mix, as insurers invest their float—or the premiums customers pay—in safe fixed-income securities. But they don’t have the same liquidity issues some banks can run across if customers decide to withdraw all at once.
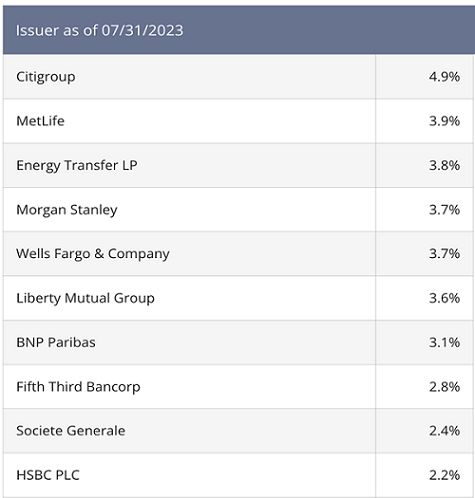
FFC hedges us from that risk in another way, too, with preferreds from big players like Citigroup, Wells Fargo and Morgan Stanley (MS) making up the bulk of bank issues in its top 10 holdings.
FFC also has a global tilt. A little more than a quarter of the portfolio is invested in international preferreds, from countries including the U.K. (7%), France (6%) and Canada (3%).
A big difference here is credit quality; less than half of FFC’s portfolio is investment-grade in nature. But it can rev up its yield with nearly 40% debt leverage, much like HPI.
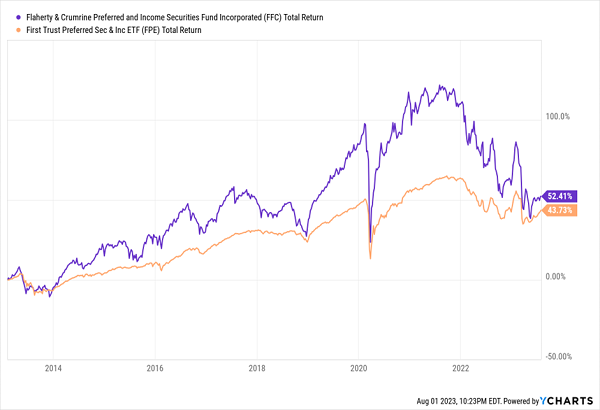
The result, over the past decade, has been a roller-coaster performance—one where the difference between outperformance and underperformance is stark, and largely determined by your entry point.
FFC: Big Swings, But for Now, Little to Show for It
This post originally appeared at Contrarian Outlook.
Category: Dividend Yield


