Dividend Payout Ratio Essentials
Things are rarely as simple as they seem, and rarely as simple as we’d like them to be…
Especially when it comes to investing in the best dividend stocks.
You know what we should do?
All of us who follow the market should start off the day with a stiff drink of humility.
We should remember that every morning when the bell rings on the trading floor, we’re about to be treated to billions of dollars worth of irrational behavior.
Dividend investors are going to make decisions based on geo-political events, earnings reports, their own opinions, opinions from other people, and hunches.
And you know what?
The market is not, and has never been, a sensible and rational place.
But the good news is that virtually lost in all the bizarre behavior is a beautiful number.
One gorgeous and simple number we can look at that will help us make a sensible decision when it comes to investing in the best dividend stocks.
This number is easy to find, easy to understand, and can help you dodge some ugly dividend yield disasters.
This number is the Dividend Payout Ratio.
The Beauty Of Dividend Payout Ratio
The Dividend Payout Ratio is a needle of clarity in the stock market’s haystack of confusion.
Not long ago, my associate Michael Jennings revealed some of his dividend payout ratio secrets.
Why is this such a helpful number?
And what makes the Dividend Payout Ratio so important?
In a world of hype and opinion, it’s a truth-teller.
It reveals more about the company to dividend investors than virtually any other single number. It speaks volumes.
Here is how to use Dividend Payout Ratio to make money and how to stay out of trouble.
Dividend Payout Ratio Essential #1
The Dividend Payout Ratio shows you how much of the money a company makes goes to pay the dividend.
That’s all it does. It’s a quick way to see if a company is living beyond its means when it comes to rewarding stockholders.
You can see if the company is too stingy, too generous, or about right.
Dividend Payout Ratio Essential #2
The Dividend Payout Ratio shouldn’t go too much higher than 60%. When a company plows more than 60% of its net profits into dividends, one of two things is happening…
It has plenty of money and could use this money better doing something else or it has soft earnings. With soft earnings, too big a chunk of the quarter’s revenues earnings can be gobbled up to keep the dividend the same.
Dividend Payout Ratio Essential #3
When the Dividend Payout Ratio does go up over 60%, find out why. Now and then, it’s OK, and nothing more than a sign of an earnings slump.
We’re witnessing this right now with the big global energy companies. Their earnings are down, but they have plenty of money lying around to keep paying the dividend.
Dividend Payout Ratio Essential #4
Use the number to compare two dividend stocks you’re looking at. Here’s an example.
Chevron $CVX and Exxon Mobil $XOM are in the same boat, each stung by the plunge in crude oil prices.
Neither company is pulling in great revenue right now (relatively speaking).
Sure, Exxon Mobil is a lot bigger than Chevron. But it’s interesting to see how the two stack up when it comes to taking care of dividend investors with dividend yield.
Chevron pays a 4.82% yield. The Dividend Payout Ratio is 127.8%.
Exxon Mobil pays a 3.68% yield. The Dividend Payout Ratio is 78.2%.
You see what’s happening? Chevron is dipping into its savings to pay the dividend, and Exxon Mobil isn’t.
A 100% dividend payout ratio is when all the quarterly earnings go to pay the dividend.
To keep its dividend the same, and avoid a dividend cut, Chevron needs more money than it pulls in from earnings. That’s why the ratio is 127.8%.
At first blush, you might want to invest in Chevron… you get more income from the higher yield.
But the lower yield you get with Exxon Mobil comes with a few interesting upsides.
The company isn’t tapping into money it could use to make an acquisition, and in the energy business these days, there are plenty of outfits Exxon Mobil might want to buy.
The war chest is in good shape.
The lower dividend payout ratio also means Exxon Mobil isn’t stretching itself thin like Chevron.
If crude oil prices take an even longer time to rebound, Exxon Mobil has the cash to ride things out.
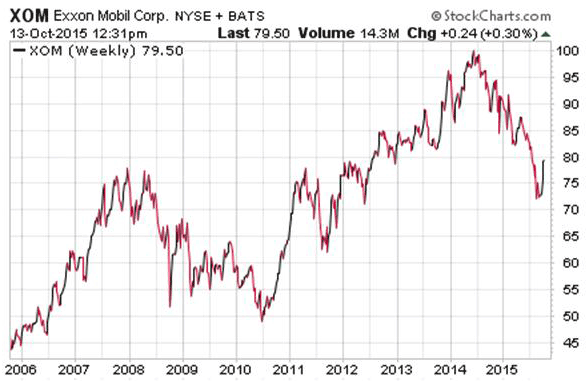
How has Exxon Mobil been doing? Check out this chart for a fascinating 10-year view…

You know what’s interesting?
Exxon Mobil hasn’t cut its dividend in ages. The dividend has been growing for 32 years.
And look at the hits the stock has taken in the past 10 years.
Just a year ago Exxon Mobil stock was at $97.
Today, it’s trading close to $80, clawing back from the downturn triggered by the collapse in crude oil prices.
When Exxon Mobil revenues snap back, if the dividend payment says the same, the dividend payout ratio will drop.
If revenues don’t just snap back, but roar back and explode, it’s not unreasonable to expect another dividend increase.
Not a bad thing.
Seeing where income from the highest paying dividend stocks could be heading comes into a bit better focus when you watch the dividend payout ratio.
It’s a nice, simple way to size up a dividend stock.
And as Albert Einstein reminded us, “Everything should be made as simple as possible, but not simpler.”
Cordially,
Paul Duke
Note: Paul Duke writes and edits DividendStocksResearch.com. Sign up for our free dividend reports and dividend newsletter at https://www.dividendstocksresearch.com/free-sign-up. We’ll show you how to create regular income by investing in dividend stocks, easily, step-by-step.
Category: Dividend Basics


