
3 Easy Steps To Unlock Big 7.5% Dividends (Paid Monthly, To Boot)

Last Monday, we talked about the two biggest mistakes many investors make when buying high-yielding closed-end funds (CEFs). Today we’re taking the opposite tack and delving into three things to look for to pick the very best of these 7.5%+ payers for your portfolio.
The upshot? If all three of these strengths are present, you likely have yourself a winner. But first things first—let’s talk a bit about what sets CEFs apart. These funds are different from ETFs and mutual funds in two key ways.
- CEFs have fixed share counts and generally can’t issue new shares to new investors (hence the “closed” in the name).
- CEFs aim to maximize payouts to shareholders through regular dividend payments, with many CEFs paying every month, rather than quarterly.
These two things cause many unusual side effects we can profit from—and regularly do in my CEF Insider advisory. These three top the list.
CEF Buy Indicator No. 1 An Unusual—or Illogical—Discount to NAV
Because CEFs can’t issue new shares to new investors, their market prices are often different than their per-share net asset value (NAV, or the value of their underlying portfolios), and they often trade at a discount. These discounts are key to our price upside in CEFs, so the first thing we need to look for is whether a fund’s discount has gotten unusually wide or narrow lately.
CEF discounts tend to revert to the mean, so if a discount or premium suddenly appears—especially if that trend isn’t happening in similar funds—it’s often a buy signal. A textbook example happened with the Virtus Dividend, Interest & Premium Strategy Fund (NFJ) back in 2016.
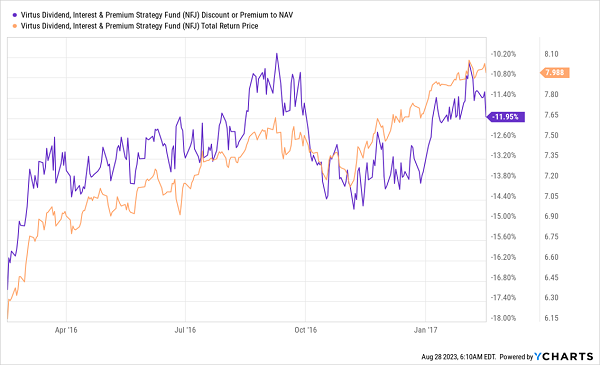
Investors saw 30% total returns (orange line above) within a year, mainly due to the fund’s unusually large 17.4% discount fading to a still-high 10% discount. That was a peak, and NFJ’s discount widened in October 2016 and stayed rangebound for three months, giving investors plenty of time to decide whether to sell or hold while profits kept climbing.
This is normal in CEFs, and it’s their real power. NFJ’s 8.1% yield is impressive, but the real story is the way you can earn a yield like that and get capital gains by buying low and selling high. And CEFs’ discounts clearly indicate when it’s time to do either.
CEF Buy Signal No. 2: The CEF Is Beating Its Index (but Make Sure It’s the Right Index)
CEFs are actively managed, and active management gets a bad rap. Moreover, wealth managers don’t generally recommend CEFs. With these two things in mind, it’s no surprise that many investors initially look at CEFs with suspicion.
That’s kind of silly. First, CEFs are publicly traded, SEC-registered funds based in the US—they are not some kind of wild west! In fact, CEFs are a sleepy part of markets, which is why they get little attention, although that makes no sense given that they yield an average 7.5% and offer diversification on top of their income potential.
CEFs don’t help themselves by making their benchmark indices hard to find and understand. Take, for instance, the Eaton Vance Enhanced Equity Income II Fund (EOS), which benchmarks against the obscure USD CBOE S&P 500 BuyWrite Index. But even though this index is not nearly as well-known as the S&P 500, it’s still important. And EOS has crushed it:
EOS Blows By Its Index
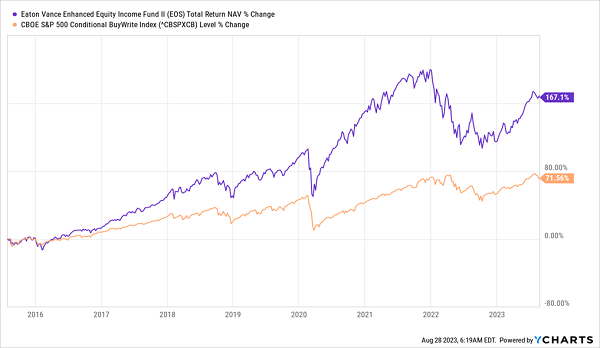
When a fund is ahead of its index on a total-NAV-return basis (or based on the performance of its underlying portfolio, including dividends), you know it’s worth your attention. But comparing it to a more famous index that the fund isn’t basing itself on will lead to misleading results. Yet it’s a common mistake that both retail investors and pros make.
CEF Buy Signal No. 3: A Strong Portfolio and Management Team
I’ll admit, this last one is the hardest factors to judge. CEFs often hold hundreds of assets, and you often don’t know how much the fund paid for them. If you see a fund has, for example, a bond issued by the Argentinian government (one of the most famous countries for not paying its bills), you might be wary. But did the fund buy that bond at full price or at a 99% discount? In the second case, that’s an entirely different story, but CEFs just don’t tell us this kind of detail.
There are other ways of analyzing a fund’s portfolio, though: by going through its monthly and quarterly filings, you can get a close estimate of what it paid for assets, and looking at its portfolio turnover tells you how management thinks and where it’s going.
To show you what I mean, let’s compare the total NAV returns of the aforementioned NFJ (in orange below) and EOS (in purple), since 2005, when both funds were launched. Both CEFs are covered-call funds with similar strategies.
Similar Strategies, Vastly Different Results
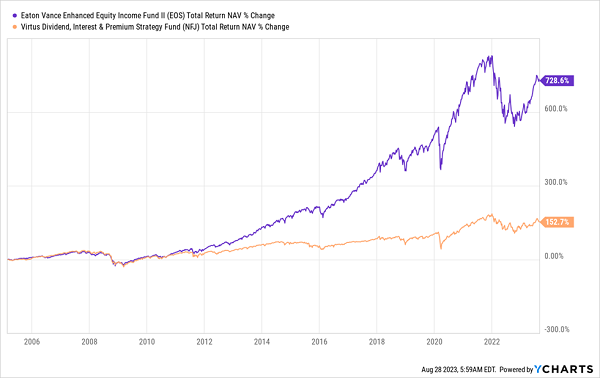
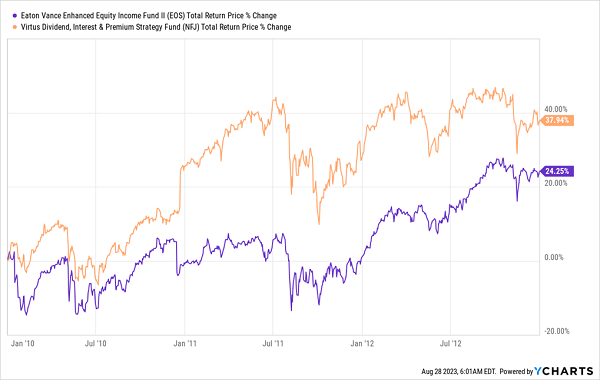
As you can see, EOS has outperformed NFJ by almost a factor of five, showing that NFJ is only a short-term buy when its discount is unusually low and EOS’s is not, like in early 2010, when NFJ’s discount was 17% and EOS traded at over a 10% premium; NFJ outperformed EOS on a market-price basis for three years after that (beyond which EOS caught up and started overtaking NFJ):
Closing Discount Gave EOS an Edge
Today, EOS’s discount has widened as retail investors remain reluctant to come back into the market. But the less-active and in-demand NFJ’s discount has stayed constant:
A Smaller but Widening Discount
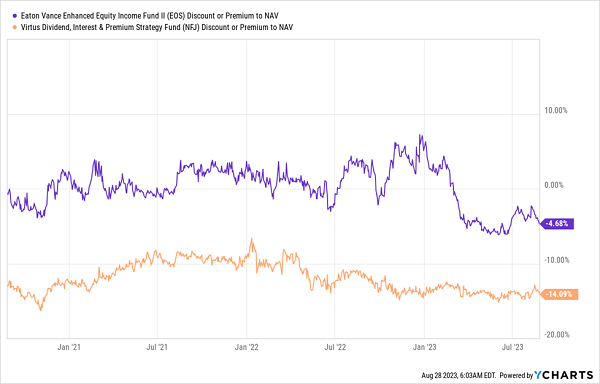
In a situation like this, given EOS’s long-term outperformance, it’s the better buy, even though its 7.9% yield is essentially the same as NFJ’s 8.1%. Perhaps that slightly smaller yield is why its discount is bigger, even though EOS has returned much more in dividends and gains over the long haul than NFJ.
Who knows, but mispricings like this are the kind of opportunities that a bit of CEF research uncovers. And there are always opportunities like these across the CEF space.
Your Best Move: Let Me Pick Your Next 8%+ Yielding CEFs
We started our CEF Insider service to give investors the price gains and high income CEFs offer without having to navigate these funds’ complex filings all by themselves.
The best way for you to experience CEF Insider is to try it out for yourself, which is why I’m inviting you to road test the service for 60 days. Peruse the portfolio, check out our library of Special Reports outlining the nuts and bolts of CEF investing. Get our next two monthly issues as soon as I send them out to members. It’s all part of your 60-day trial.
This post originally appeared at Contrarian Outlook.
Category: Dividend Stocks


