
Digging Into A Popular Dividend ETF

A few months ago, we talked about Charles Schwab (ticker: SCHW), a financial services company.
Schwab has averaged over 11% dividend growth each year over the past two decades.
It’s on quite a run for dividend investors.
But we’re not going to talk about Schwab.
Instead, let’s discuss one of Schwab’s most popular products, the Schwab U.S. Dividend Equity ETF (ticker: SCHD).
SCHD is the second-largest dividend exchange-traded fund (ETF) available, managing almost $100 billion in assets.
Why is it among everyone’s favorites?
SCHD has an interesting strategy for dividend investing.
It tracks the Dow Jones U.S. Dividend 100 Index, which looks for high-yielding dividend stocks with consistent dividend payments and excellent financial strength.
Sounds great, but how does Dow Jones determine “excellent financial strength”?
They calculate a composite score for every company with at least 10 years of dividend payments and a market value of at least $500 million.
The composite score ranks each company based on the following metrics:
- Dividend yield: an obvious choice, since we want companies with high dividend yields.
- Dividend growth: calculated using the growth rate for dividends over the past 5 years.
- Return on Equity (ROE): measures how profitable the company is for its investors.
- Free Cash Flow / Debt: a very important metric for dividend stocks since it compares a company’s cash generation with its debt obligations.
Dow Jones then takes the top 100 stocks using the score and creates the Dow Jones U.S. Dividend 100 Index.
If a company drops out of the top 100 but still remains in the top 200, it stays in the index.
Otherwise, it gets sold and another stock takes its place.
How does SCHD track the Dow Jones U.S. Dividend 100 Index?
SCHD just copies whatever the index does, which is pretty easy.
Since SCHD doesn’t need to do a lot of work, it only has a 0.06% expense ratio.
So, for every $10,000 you invest in SCHD, you only pay Schwab $6 in fees.
Not a bad deal!
How does SCHD perform relative to the overall market?
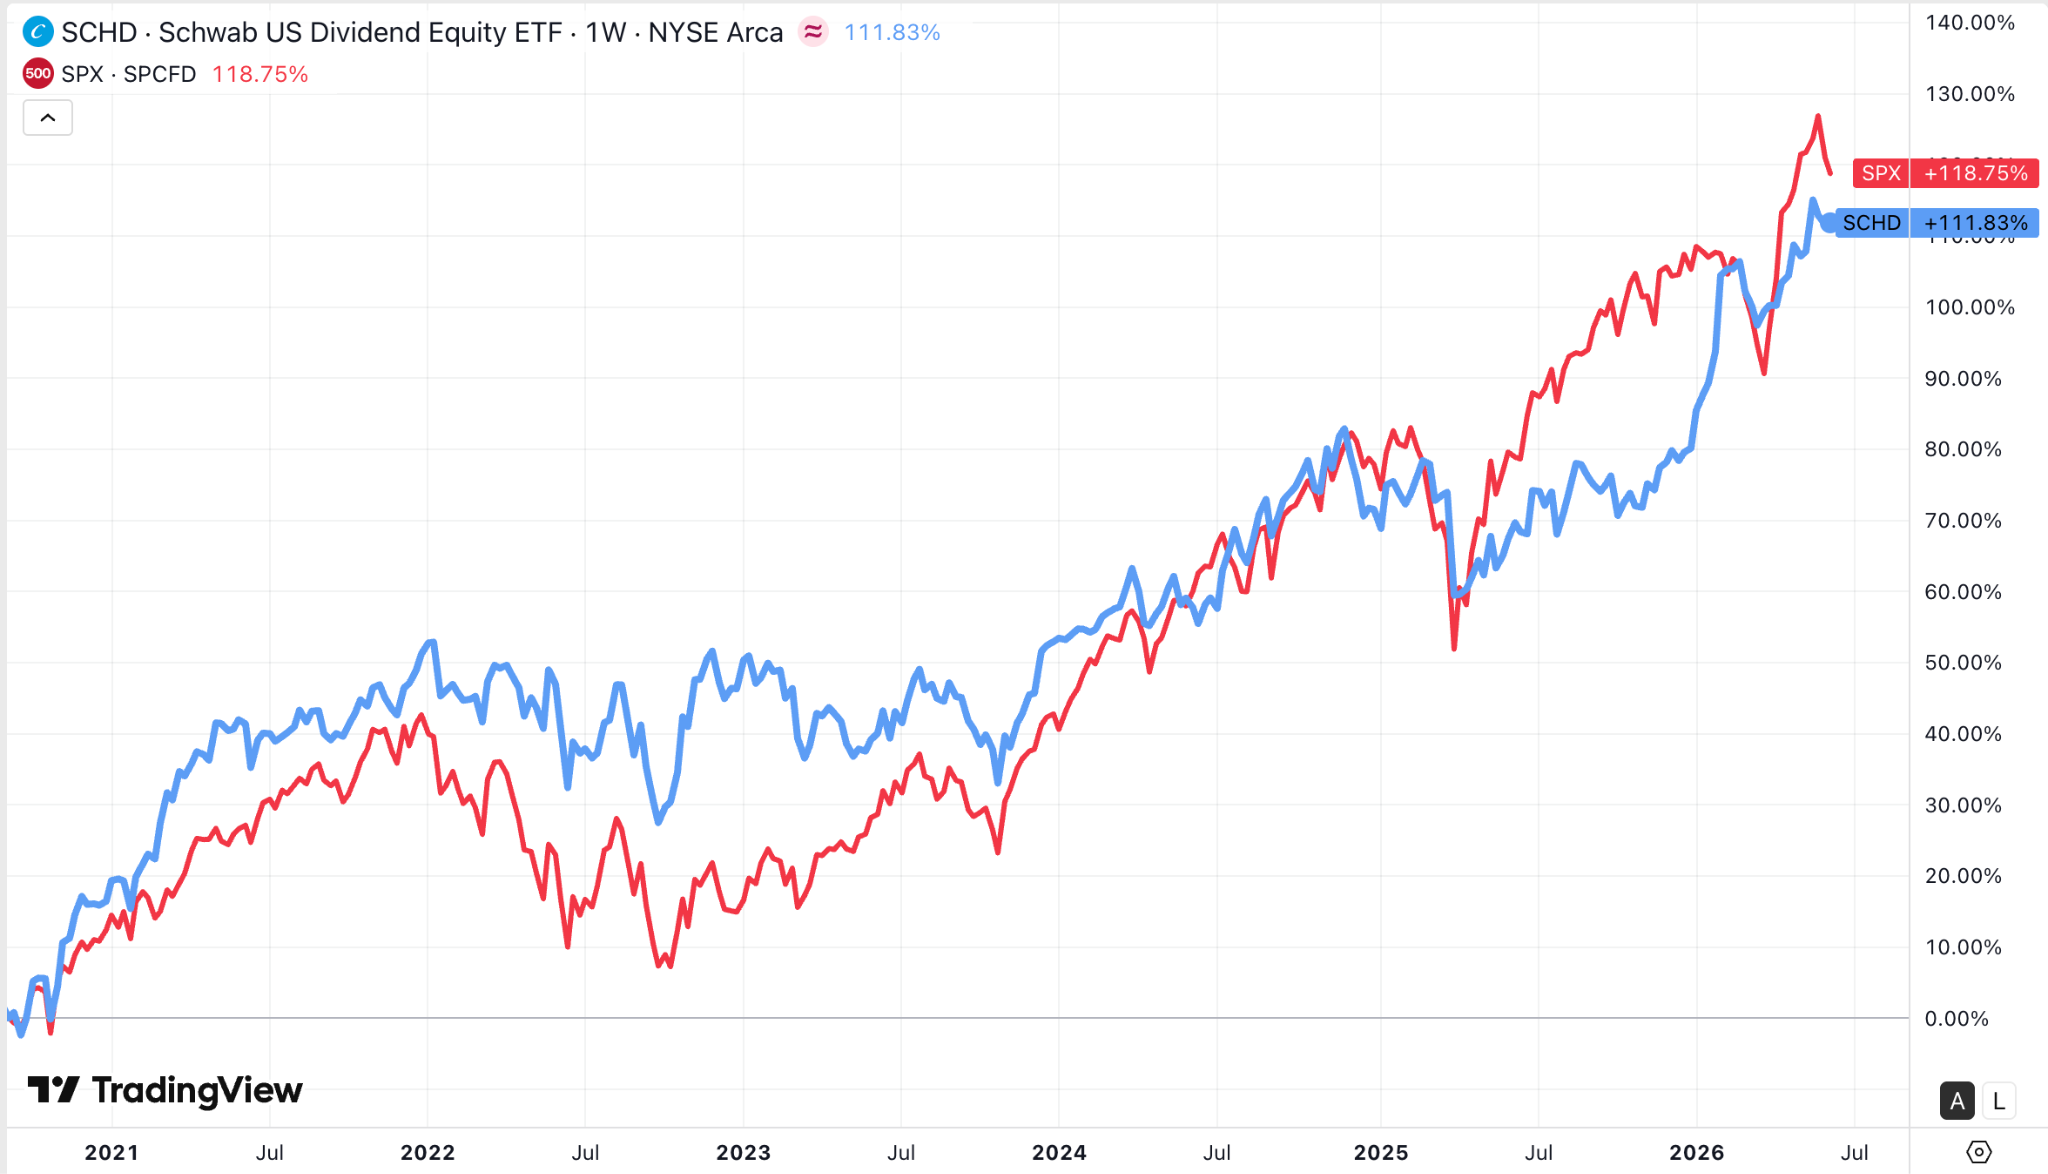
Compared to the S&P 500, it performs slightly worse… but there’s more to investing than just performance.
When the S&P 500 was down in 2022, SCHD was relatively flat.
But when the S&P 500 recovered starting in 2023, it rose much faster than SCHD.
The same pattern happened during the tariff crash in early 2025.
Is it a bad thing?
Well, I don’t like my portfolio whipsawing back and forth every month.
And SCHD, while still volatile, is a lot smoother than the overall market.
Beta measures how much an investment’s price moves relative to the overall market.
We’ve talked about beta before, but as a quick recap, the market has a beta of 1.0 and we like our picks to be less risky.
The beta for SCHD is only 0.68, which means it’s a lot less volatile than the overall market.
Plus, when you throw in SCHD’s 3.2% dividend yield, which is almost 3x higher than the S&P 500’s yield, you’ve got a pretty special ETF.
I’m sure some of you already own some SCHD, so what do you think of it?
Send me a note with some of your thoughts about Schwab’s really popular ETF.
Michael Jennings
Dividend Stocks Research
Category: Dividend Stocks To Buy?


